When performing unit tests on code, how do you know if your unit tests are covering all of the code? The answer is a code coverage tool. I first used a tool like this when I was on the Microsoft Access 1.0 programming team, where we got weekly reports on how well the unit tests were covering the code. Microsoft has a code coverage tool in Visual Studio 2017, but only in the Enterprise edition. Unit tests and code coverage go together, and for Microsoft to have unit tests in the Community and Professional releases but not code coverage is kind of dumb.
Fortunately, there is a pretty competent, free, third party choice called AxoCover. You can download it from the Extensions and Updates menu item on the Tools menu in Visual Studio. It places an AxoCover menu item on the Tools menu that brings up a window to control its use. Build your solution once for AxoCover to figure out what is in there to cover. Then on the AxoCover window, click the Run button at the top. This is what it will look like:
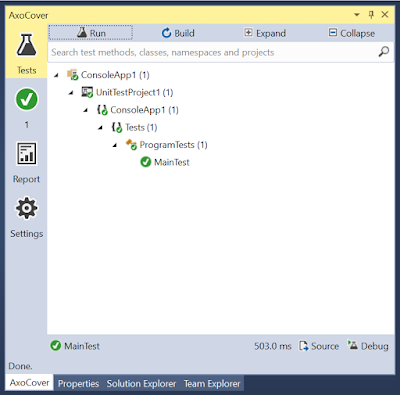 |
| AxoCover window in Visual Studio 2017 |
The critical information is on the Report tab on the left. After running the tests, AxoCover shows how much of the code got covered by percent. There are two numbers: what percent of lines and what percent of branches got covered. If there is an "if" statement, a test that hits the line counts will result in the line counting 100%, but only if both the true and false conditions are tested will the branches show 100%.
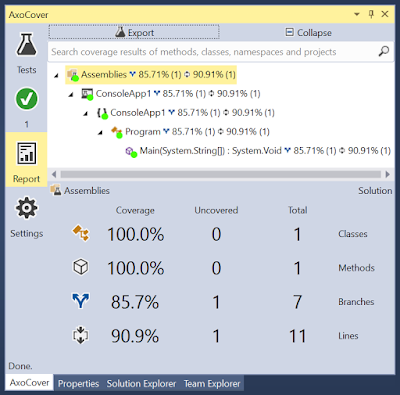 |
| AxoCover report tab |
The goal here is to get the branches to over 90%. Why not 100%? In production code, there are sometimes error handling code that can happen in only the rarest of conditions. For example: there may be code to handle if the fixed hard drive that you are writing to fails while the program is running. Sometimes trying to create a unit test for these conditions is difficult or impossible. So in general, greater than 90% is considered covered. Obviously, higher is better, but if all of your code is at 90%, you are doing pretty well. So in the example above, the coverage is 85.7%, which is good, but not good enough.
After running the tests, you can right click on a procedure in the report window and select "Show source". The source will show, with some information on the left border on what was covered and what wasn't.
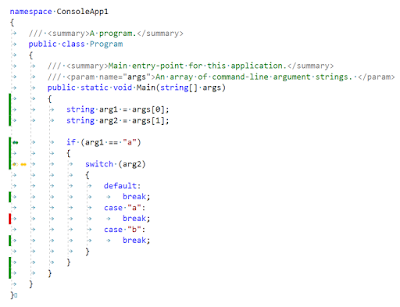 |
| Code window after running AxoCover |
The green bar show lines that were covered by the unit tests. The red bar shows lines that were uncovered. The little circles show if branches were covered. In an "if" statement, you want both circles filled in. In the example above, there needs to be a unit test that covers the case "a" branch of the switch statement. After adding a unit test that covers that statement, go back to the Tests tab, build and run the tests. The report tab, then looks like this:
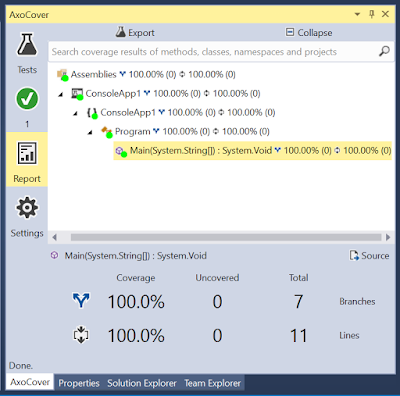 |
| AxoCover report after adding new test case |
Here, the coverage is perfect.
If there is one thing lacking on AxoCover, it's the documentation. The Settings tab has pretty much all of the documentation that exists.
AxoCover is really just a UI that integrate into Visual Studio. The engine that drives the code coverage is a different open source project called OpenCover, that has a command-line only interface. OpenCover is installed automatically when you install AxoCover.


thanku
ReplyDeletehow to exclude a project from the coverage report.
ReplyDeleteAny ideas why I wouldn't have the Report tab after running the tests?
ReplyDeletehow to exclude a project from the coverage report.
ReplyDeleteinstructions to reject an undertaking from the inclusion report.
ReplyDelete